Visibility Analyses
Learn how to conduct detailed SEO analyses using XOVI’s online value index value with the help of practical examples. Identify visibility trends and increase your long term success in Google.
OVI fluctuations
The XOVI OVI reflects the visibility index of a domain within the top 100 rankings for certain keywords. Google considers over 200 factors to calculate visibility indices, ensuring high-quality search results for individual keywords. These SEO factors are weighted differently within the algorithm, meaning changes can significantly impact a domain’s visibility, such as its OVI (Online Visibility Index).
When calculating the OVI, several elements come into play—not only Google’s negative evaluation of technical errors but also factors like user behavior (e.g., time spent on a page and return-to-SERP rates) and the performance improvements or declines of competitors.
Intepreting trends
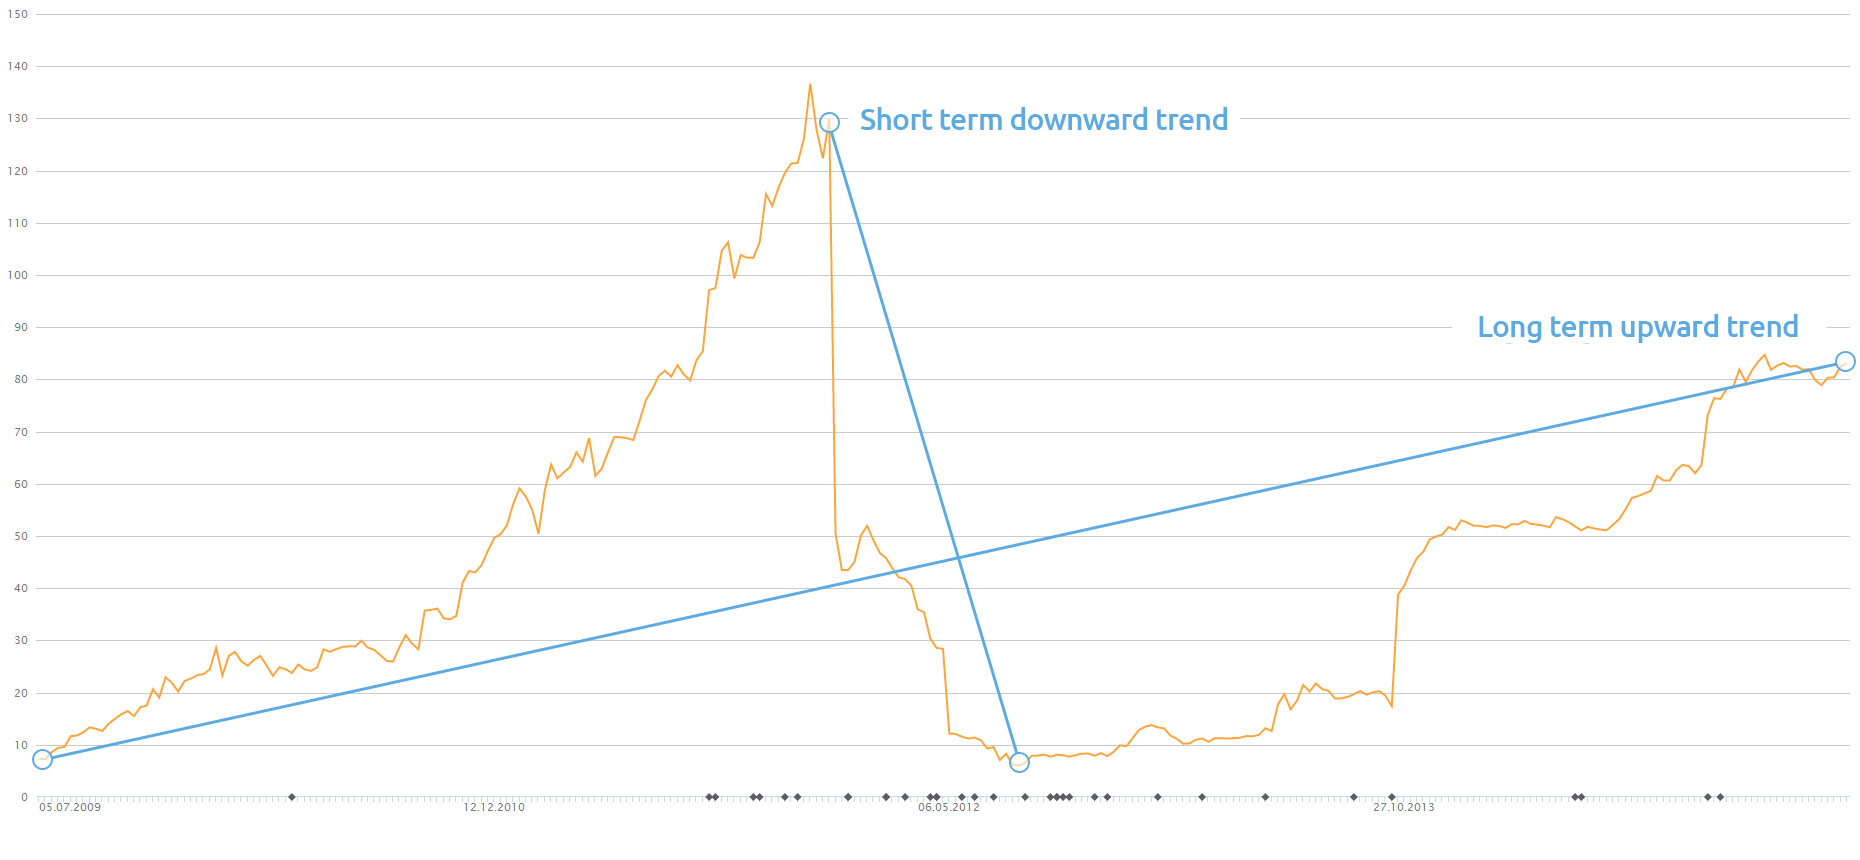
Just as stock exchange trends are a good indicator of the development of share prices, Google trends provide a clue as to the changing visibility of a website in its index.When it comes to search engine optimization, trends can warn you if your domain is about to stray from the path. Charts and graphs are used to better interpret trends and differentiate easily between long term increases or declines and short term blips. The latter are particularly useful since they reveal the effects of minor changes and adjustments in relation to a more comprehensive general trend.
Classifying trends

XOVI identifies three types of trends: primary, secondary, and tertiary. The primary trend reflects the long-term trajectory, typically covering 1 to 2 years in search engine optimization. The secondary trend represents a medium-term perspective, spanning 1 to 12 months. The tertiary trend focuses on immediate changes, covering a period of up to 4 weeks.
The duration of each trend type may vary depending on the size and scope of a project. For example, smaller projects or those targeting niche markets with low competition may have shorter time spans, while larger projects with broader objectives require extended time frames. Trend classifications and time spans should be agreed upon between the agency and the customer, aligning with defined targets and goals. For larger online projects, longer time spans are generally more appropriate.
Tip
The keyword overview in the XOVI Suite shows the current long, medium and short term OVI trends for the domain. By default, these are set to:
- Primary trend (long term) – 2 years (104 weeks)
- Secondary trend (medium term) – 6 months (26 weeks)
- Tertiary trend (short term) – 1 month (4 weeks)
These settings can be changed in Account > Settings for all domain checks. The specifications for indivudal projects can also be changed in the project settings.
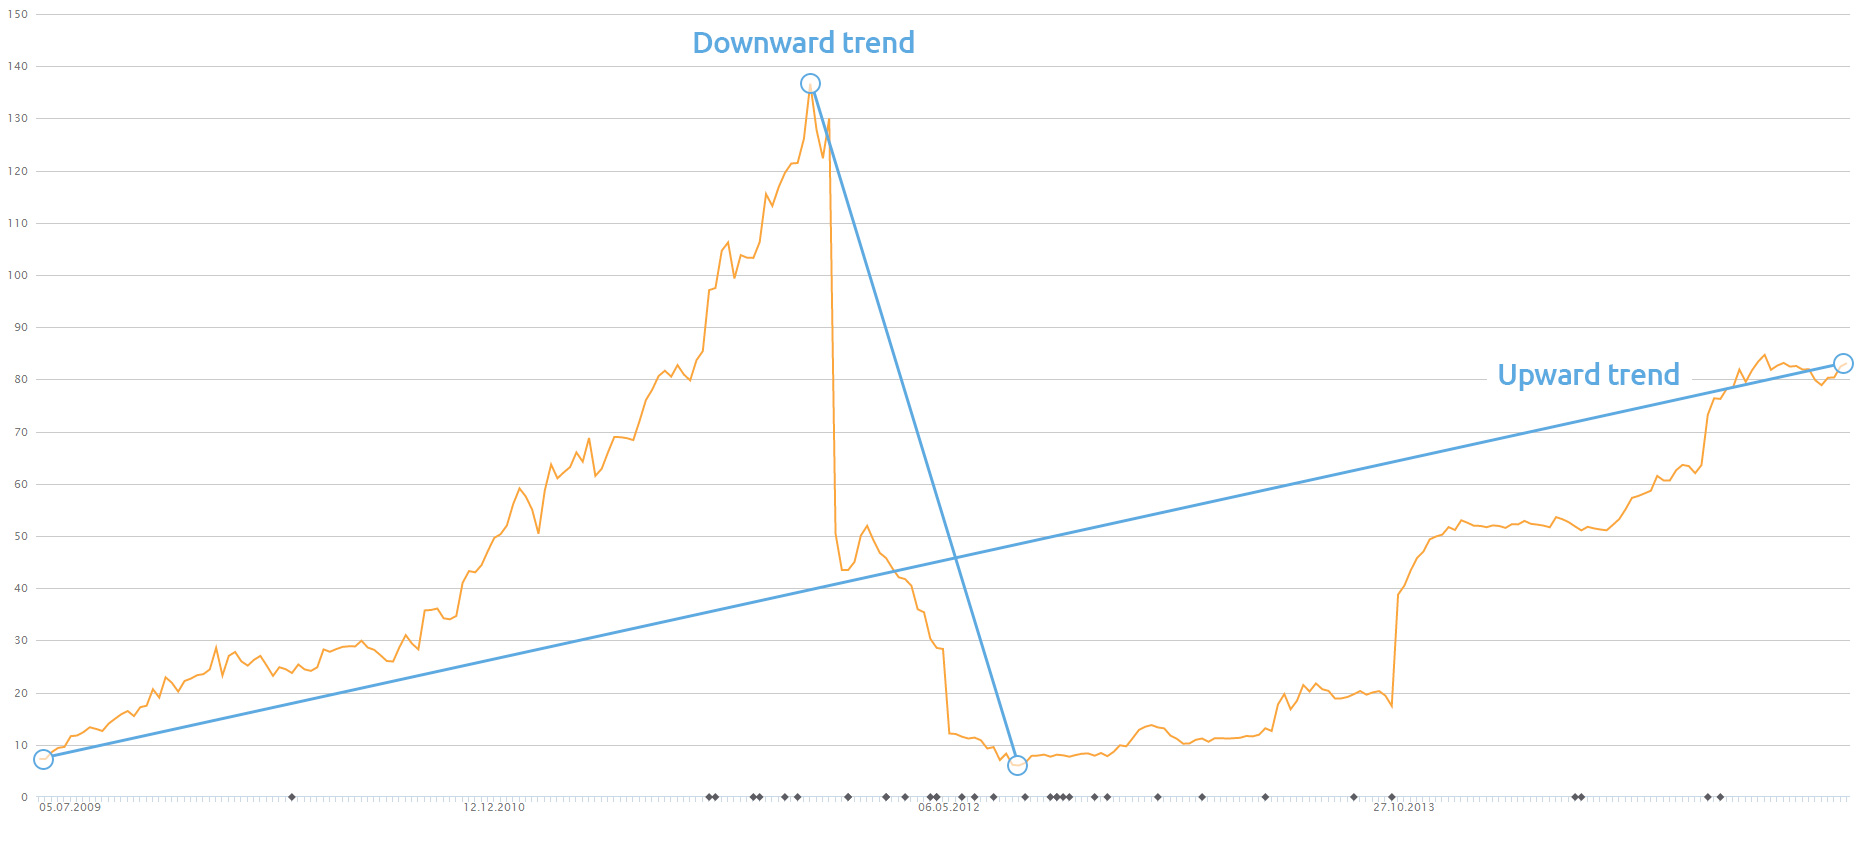
Trend lines
Trend lines help us to predict future development of a trend based on historic performance. Trend lines consist of peaks and troughs. A significant change in direction can give a clue as to the future development of the trend.
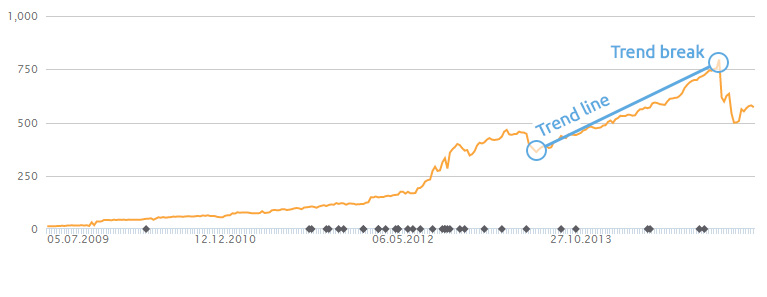
Trend channels
In addition to trend lines, trend channels offer another way of analyzing visibility. Trend channels can be identified and overlaid in order to see not just the direction of a change, but the extent to which it alters over a period of time. If a trend channel is identifiable following a trend break, it is likely to point to a significant new phase in the development of the trend, and should therefore be analyzed and monitored more closely.
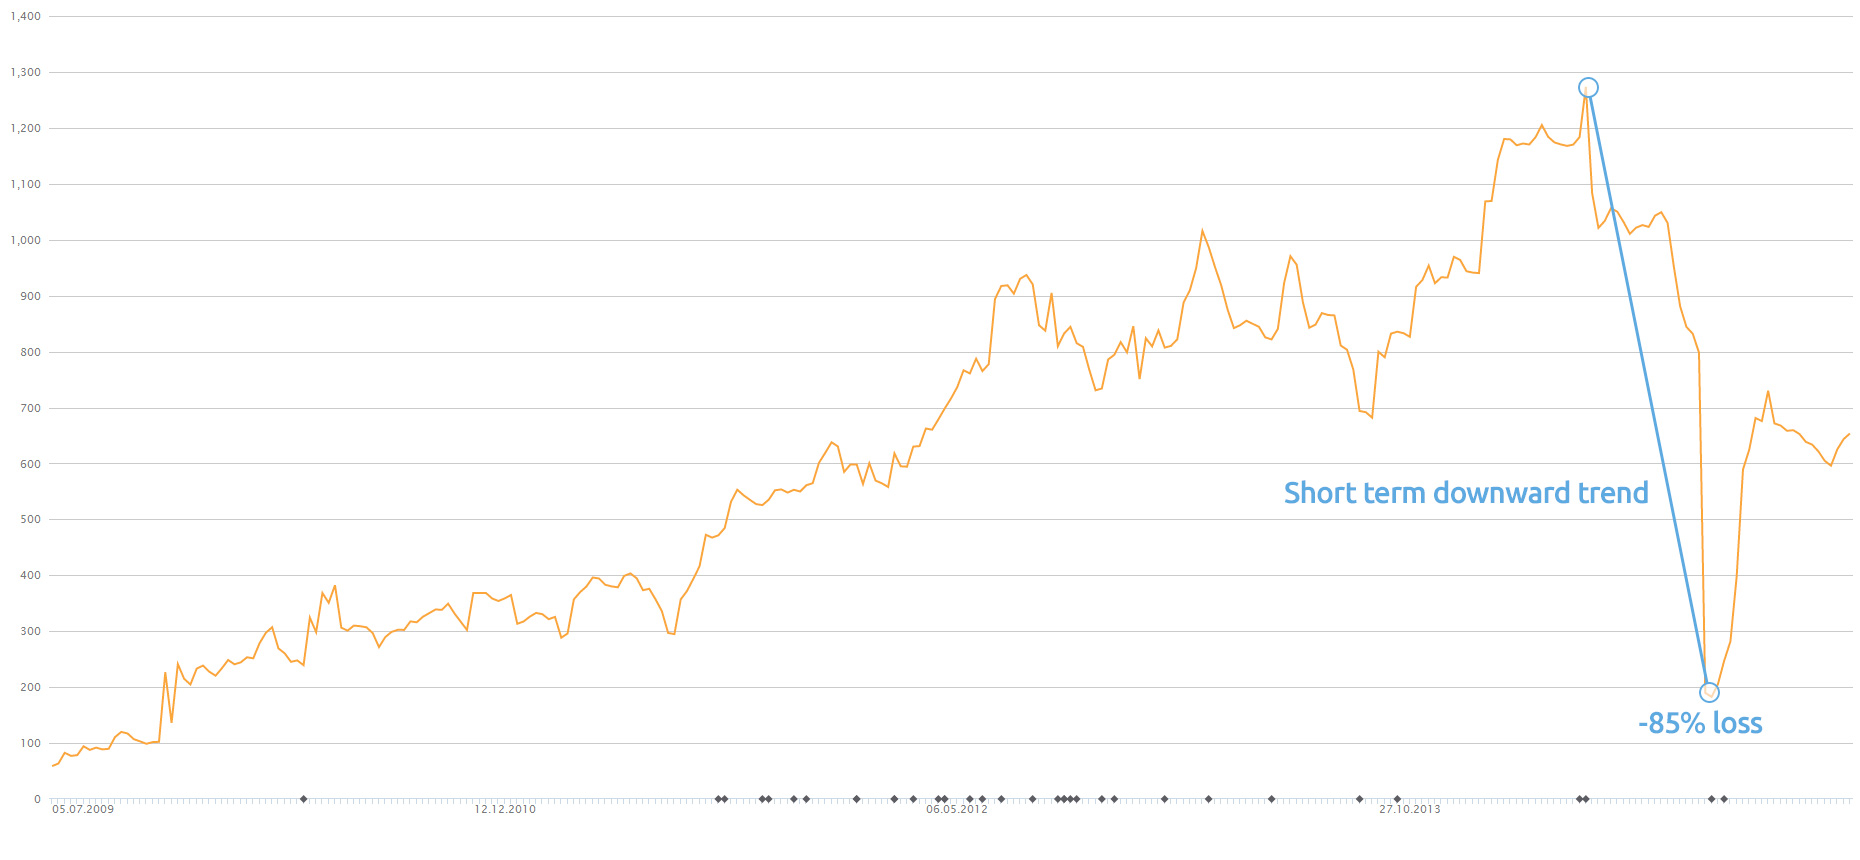
The recent case of this example domain demonstrated just how quickly Google responds to poor SEO. Following a number of internal changes and mistakes in the restructuring of the domain’s navigational structure, a number of pages were rendered inaccessible or had links leading to error pages. Within a few days, Google had removed the pages from its index, resulting in a substantial loss of “trust” in the domain. Visibility collapsed and the website’s visibility index value dropped by 85%.
Similarly, the case of a financial giant reveals the consequences of infringing Google’s “rules” or even committing the most basic of SEO errors. Incoming links from external websites (backlinks) remain as important as ever for good search engine optimization since they boost the online “reputation” of a domain. But in this case, backlinks were bought. Not only that, the domain engaged in a cooperation with external “affiliates” who were to advertise the domain on a commission basis. This involved promoting content on the affiliate pages and linking it directly back to the original website. These “unnatural” links were immediately flagged in Google’s algorithm and resulted in a manual penalty and a severe drop in visibility.
The website was able to regain some of its lost visibility points with a successful restructuring and readjustment of its system, but it can take months or even years to fully recover from a Google penalty and restore a domain to its original position in the visibility index.
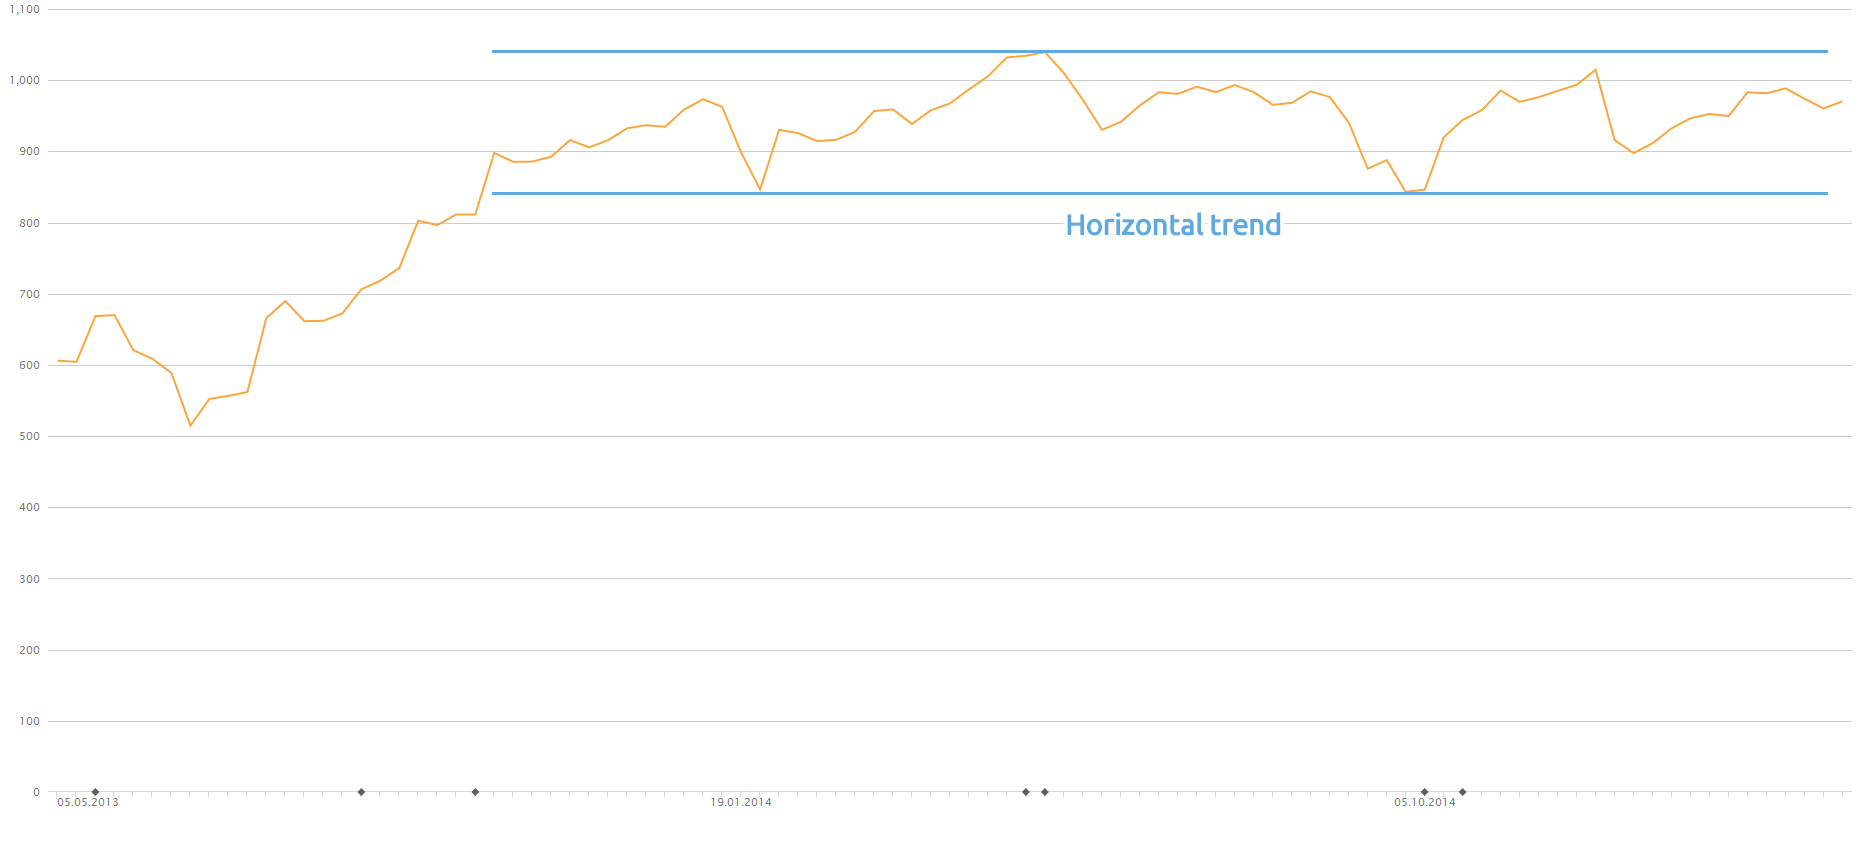
Horizontal trend channels on the other hand occur when a domain exhibits regular fluctuations over a period of time but always within constant upper and lower limits. Such trends are typical of a domain which invests little or nothing at all in search engine optimization.
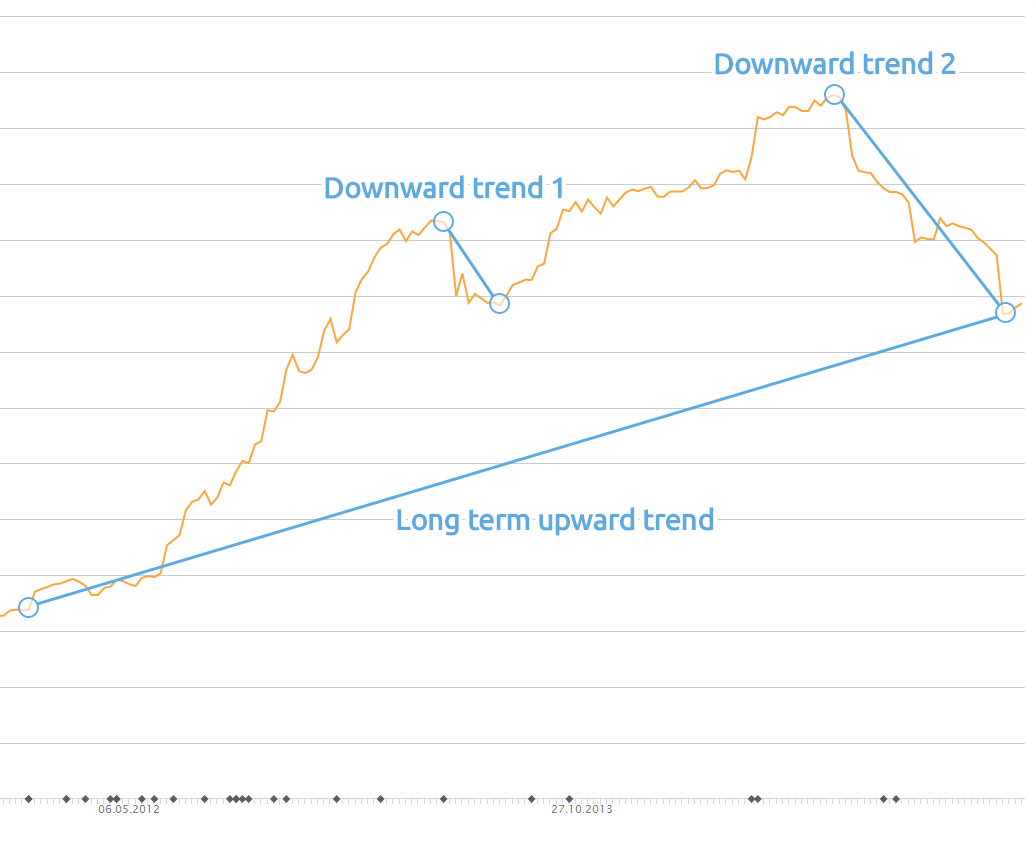
Case study #1
(large online retailer)
Downward trend 1:
The first ranking collapse and accompanying downward trend coincided with the roll-out of Google’s Penguin 2.0 update on the 19th May 2013, which starkly altered search engine results. The website was able to recover relatively quickly.
Downward trend 2:
The second collapse is more interesting. More substantial than the first drop in summer 2013, the second ranking decrease was also accompanied by a signifcant drop in top 10 rankings. Its highest ranking value was reached on the 16th June 2014 but by the 2nd February 2015 this had dropped by 85%, including an 18% loss of top 10 rankings, leaving the retail giant back at its old visibility value from the 16th September 2013.
Case Study #2
(finance portal)
Due to unnatural link building and a resulting manual Google penalty, a finance portal suffered a collapse of shocking proportions on the 27th November 2011, its visibility crashing to the level of small niche websites. It was until October 2014 that the website was able to regain a similar ranking in Google.