“Optimise for the user – not for Google!“ is a commonly heard phrase in the SEO industry – and for good reason. There are approximately 200 Google ranking factors which are predominantly based on user signals. In other words, an evaluation of the behaviour of users who come to a website via a Google search. Here, CTR (click through rate), the number of clicks on your search result on Google’s search results page, plays an important role. The opposite is the Bounce Rate, where Google measures how many users return to the search results having clicked on your website, enabling them to determine whether your website is suited to that particular keyword or not.
One reason for a high bounce rate is a website’s load time. This doesn’t just refer to server reaction time, but also the time it takes for other content on the page to fully load in the browser window. Google measures and evaluates this during the crawling process. The results then influence the website’s ranking, along with a host of other factors. Simply put, websites which load quicker rank higher than slow loading pages.
This makes perfect sense both in Google’s eyes as well as from the point of view of the user. Try it for yourself and you’ll see how much more satisfying it is when a website loads immediately without having to wait for what can feel like an age, only for the page to not even contain the information you’re looking for! For most us, our patience runs out and we return to Google’s results pages where we choose a different website.
What makes a website quicker?
Webmasters have numerous options when it comes to speeding up their website. Here’s a non-exhaustive list of action you can take:
Use a fast server
Don’t always go for the cheapest tariff when choosing your server or web hosting package. The cheapest are often the slowest. Talk to colleagues and friends about their experiences. A good host can make all the difference when it comes to server reaction times.
Use browser caching
Browser caching is particularly recommended for websites which have a high proportion of returning visitors. Content is stored in the browser’s cache and, as long as the cache isn’t emptied, can be loaded locally when a visitors makes a return visit to a website – which is quicker and more satisfying for the user.
Avoid redirects and redirect chains
We are often advised to redirect URLs when identical content is accessible in a different location. Indeed, this ensures that content is found in Google even if the URL is old. These are rankings that nobody wants to lose! Nevertheless, redirects and redirect chains can often be unintentionally and needlessly created. URL A is redirected to URL B which is in turn redirected to URL C, when it would be much easier to redirect URL A directly to C in the first place. The diversion via URL isn’t necessary and slows down your website.
Reduce image sizes
High resolution images are generally not necessary online, where 72 dpi should be more than enough. A compressed image will load much quicker online than a full resolution image, and various tools are available to safely compress your pictures. We recommend Tinypng (https://tinypng.com/). A visitor to your website won‘t notice any difference in a compressed image but will doubtless be happy with an improved load time.
Avoid Content Management System (CMS) plugins
CMS plugins such as WordPress are of course a great help when it comes to expanding the functionality of your website and tailoring it to your needs. But they also increase load times since extra resources must be loaded. With the right knowledge and expertise however, many of the additional functions provided by plugins can be applied directly in PHP or CSS files. Some programming expertise is required but the result in terms of load times is certainly worth it. Furthermore, plugins can also pose a security risk. Fewer plugins = less opportunities for hackers.
To repeat: This is list is not exhaustive and contains only a selection of possible options which are easiest to implement.
Monitoring speed with XOVI PageSpeed Monitoring
The XOVI PageSpeed Monitoring Tool enables you to keep an eye on your website’s load times. Add the exact URL you wish to monitor to keep on top of developments at all times.
The PageSpeed Tool can be found in the OnPage Tool in the XOVI Suite. Before monitoring a URL, users must first have set up a project for the domain. Help on how to do this can be found in this separate article.
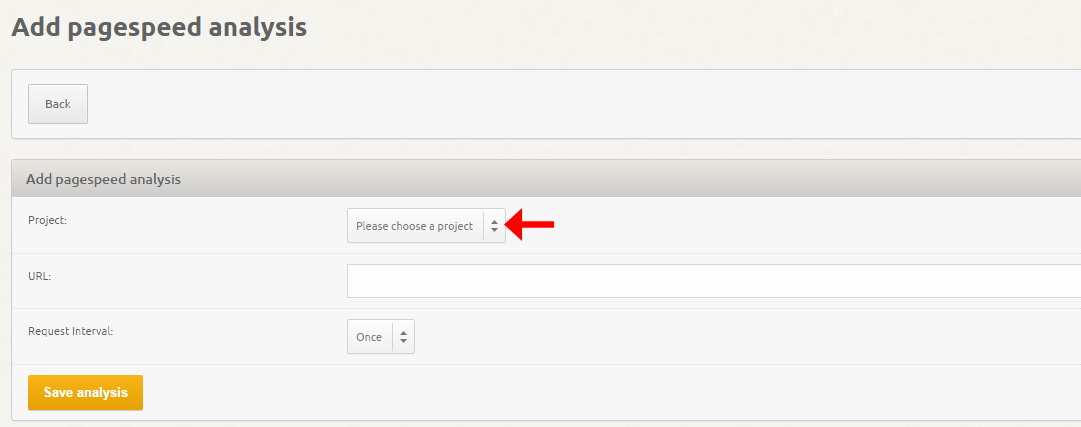
Once the project has been created, set up a new PageSpeed Monitoring job by clicking on the orange “Monitor new URL” button:

Select the project, enter the exact URK to be monitored and select your time interval. Would you like to measure load time automatically on a weekly basis or just this once? Unlike in Google’s PageSpeed Tool, where you have to start your analysis anew each time, XOVI offers automatic re-analyses of website PageSpeed. Finally, save the analysis.

Select the monitoring job to view a range of statistics relating to the URL‘s load time. As always in the XOVI Suite, the analysis begins with some key performance indicators.

Readers will no doubt be familiar with Google PageSpeed Score and Yahoo‘s YSlowScore, and both values are given here. In the case of this URL, the values are generally quite poor considering that the scale for Google PageSpeed Score goes up to 100.
We can also see that the actual load time (until the page is fully loaded) was 6.84 seconds at the last XOVI crawl – an increase on the previous time. A total of 153 requests to the server were required to fully load the site in the browser and the contents were loaded from 13 separate domains. The page is 8.66 MB, all of which must be loaded by the browser.
If you select weekly analyses, the change in loading time trends is displayed in the following graph.

Don’t worry if there seem to be some rather hefty changes – fluctuations are totally normal. For instance, sites with particularly high levels of traffic are bound to suffer from slower reaction times. It doesn’t make for a very representative result if you happen to have measured the pagespeed of a website in just that moment, which is why we recommend more long term monitoring. What’s more, there is no limit to the number of URLs you can analyse so you can monitor as many pages as you like.
If you scroll further down, you’ll come to further information and analyses related to pagespeed, such as where exactly requests come from. Let’s have a closer look at two of the most important aspects here:
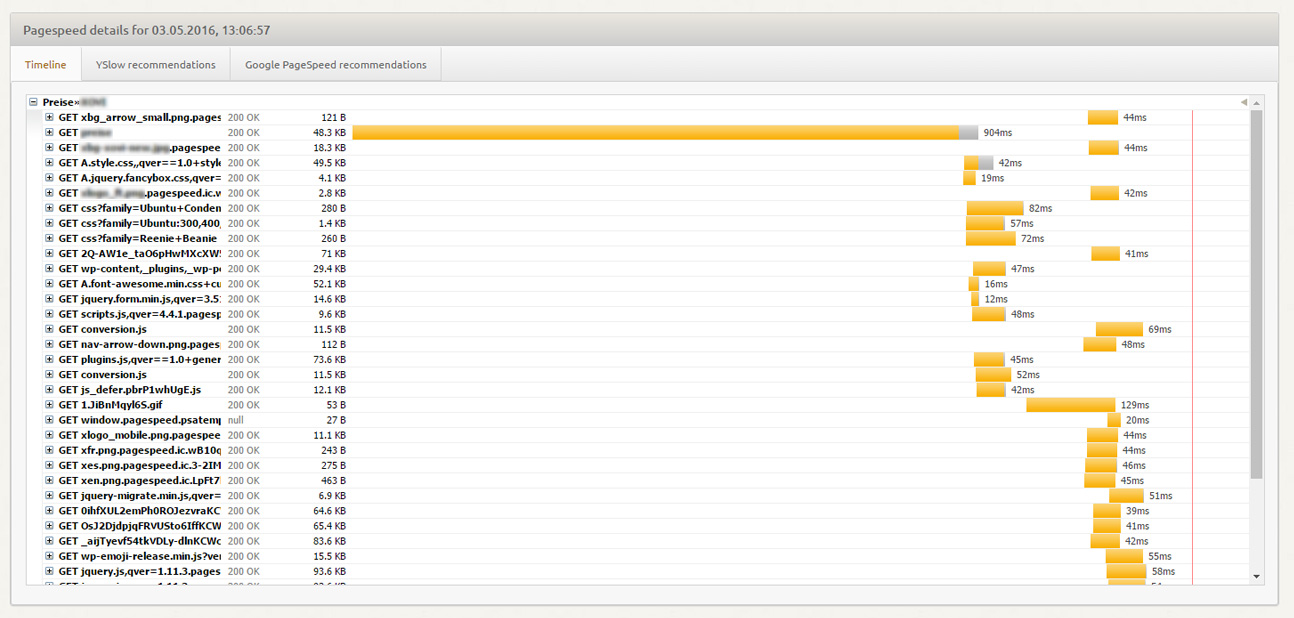
The timeline at the bottom of the overview page shows how long each request took. This enables you to identify requests which are slowing your page down and areas where you could make improvements.

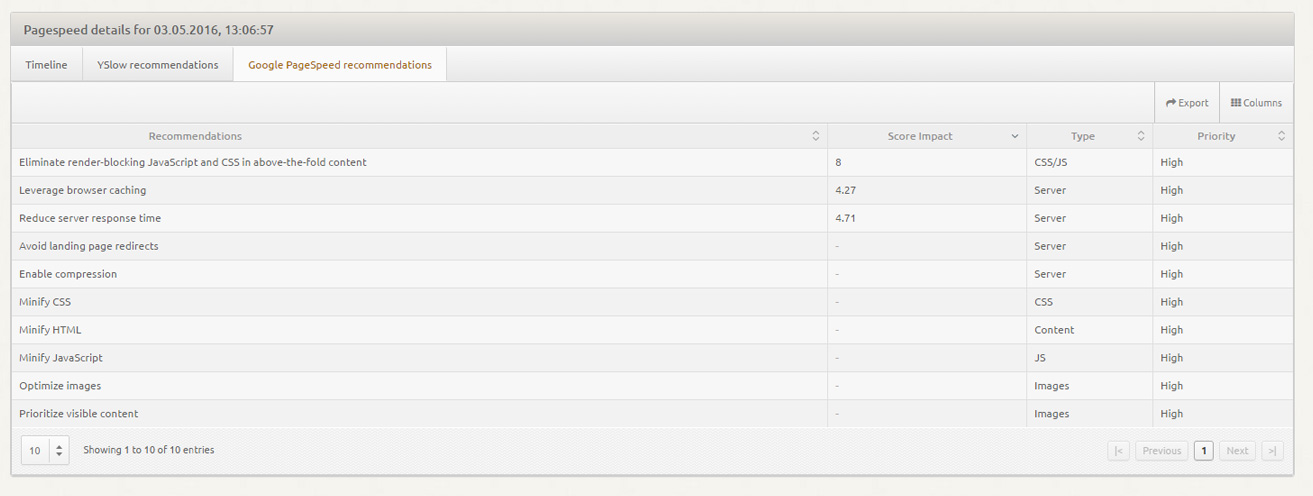
Google and Yahoo’s pagespeed tools make suggestions as to how to improve load times on your website. In XOVI, you’ll similar information in the two tabs adjacent to the timeline, such as “Use browser caching” or “Optimise images.” Follow these tips to improve the user experience for your visitors!

Conclusion
As we can see, it’s possible to make significant improvements to your pagespeed with just a few simple measures. Some, such as PHP or CSS issues, require more expertise than others. But if you feel anything is a bit beyond you, don’t be afraid to ask! Good luck!

