A quick, simple overview of all your SEO projects at a glance – that’s the aim of the dashboard in the XOVI Suite. With just a little bit of scrolling, you can access all of the most important keyword and link information about a domain on one single screen. No need to click your way through each separate tool area – all the key data is already there for you.
Non domain-specific dashboards
One key feature which sets XOVI apart from similar tools is the dashboard. XOVI dashboards aren’t tailored to specific, individual domains but instead provide a template for key performance indicators. This offers users the major advantage of not having to set up a new, domain-specific Dashboard for every single project. With XOVI’s template style dashboard, key data is simply loaded for any domain entered in the search bar. For agencies managing a large number of projects, this is a huge timesaver.
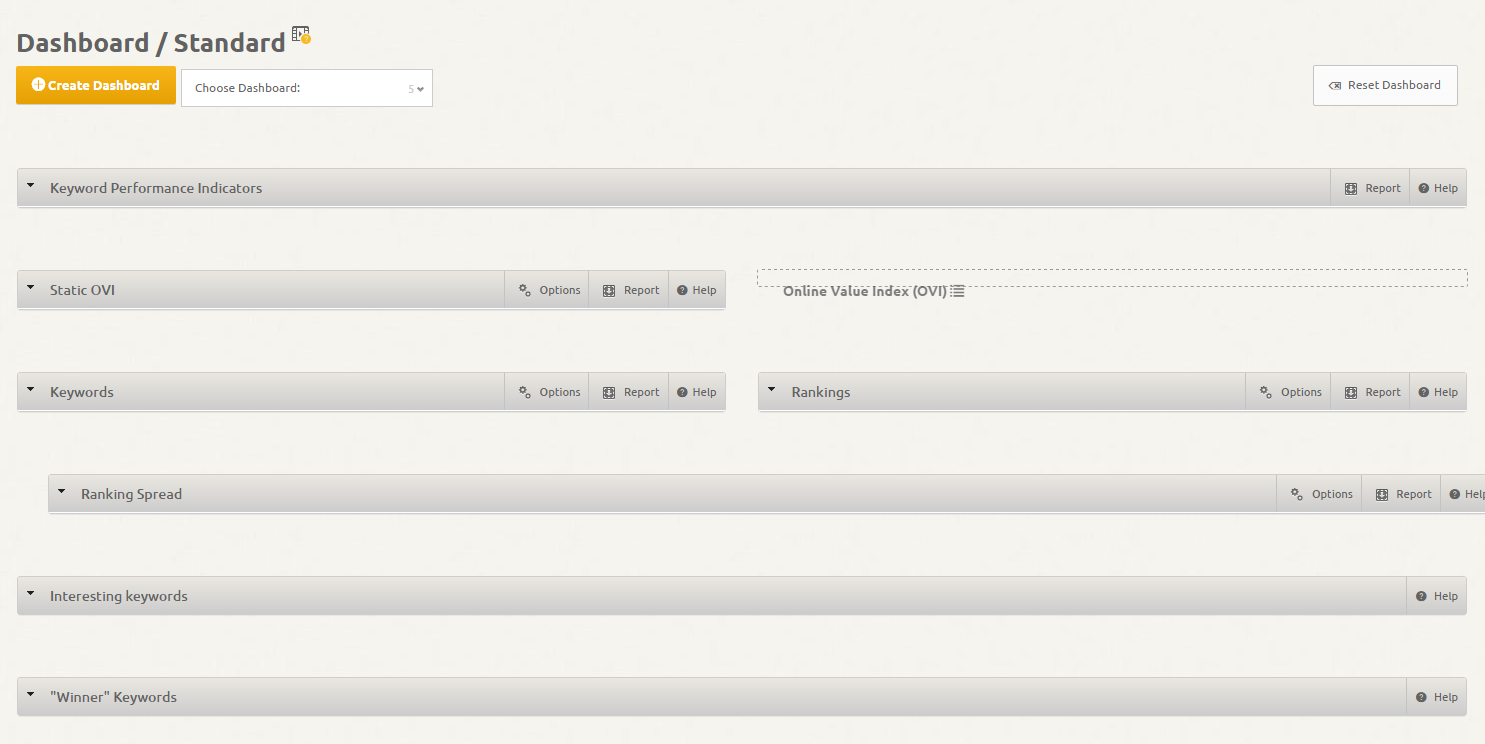
XOVI’s standard dashboard features the following table and chart templates:
- Keyword performance indicators
- Online Value Index (OVI) chart
- Keywords chart
- Rankings chart
- Ranking distribution chart
- Interesting keywords table
- Winning keywords table
- Sub-domains table
- Link performance indicators
- Social performance indicators
This is the default selection of templates chosen by XOVI.
Creating an custom dashboard
When it comes to optimizing visibility in search engines and social media, SEOs have different preferences and place emphasis on different aspects, depending on their area of expertise. In XOVI, users are free to define their own custom dashboards which the templates which are most important to them.
Let’s set up a custom dashboard now…

First, access the dashboard using the main navigation menu and click on ‘Create Dashboard’ where you will be presented with a selection of possible elements to add to your custom dashboard. You can name your dashboard too.
Select the elements you would like your dashboard to include and click on ‘Create.’ Further additions and changes can of course be made later.
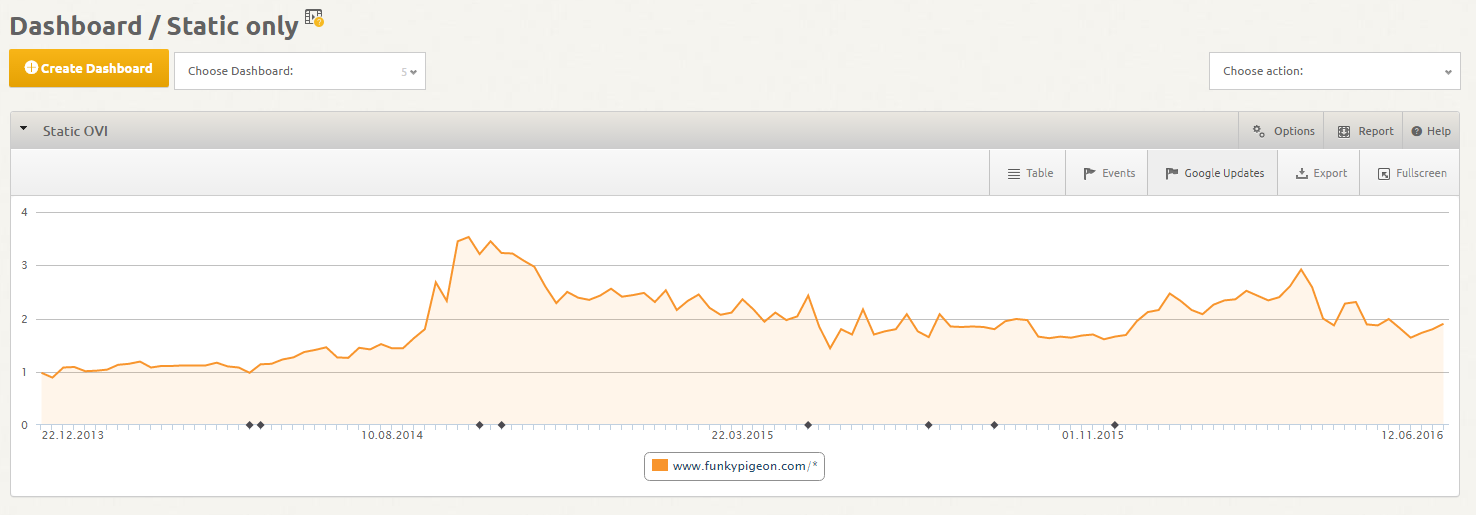
In our example, we have called the dashboard ‘Custom dashboard’ and have only added the ‘Static OVI.’ Here’s what it should look like:

Evidently, one single graphic isn’t enough for a useful, meaningful dashboard so we need to add some more elements. Every table and chart in the XOVI Suite can be added to your custom dashboard, simply by clicking on the ‘Add to Dashboard’ at the top of any graphic, similar to adding charts to reports.

When you add a table or chart to your custom dashboard, any filter settings you have applied are automatically transferred to the dashboard version. In the above example using the ‘All Keywords’ table, we have set the position filter to 1-10 in order to view only those keywords which allow the domain to rank on page one of Google. When this table is added to a custom dashboard, the filter setting is transferred too, so you only ever have to apply the filter once.
NB: for graphs and performance indicator panels, the ‘Add to dashboard’ function can be found under the ‘Report’ button.

Simply select ‘Add to dashboard’ from the mini drop-down menu.
You are then prompted to select which custom dashboard you would like to add this element to, so we select our ‘Custom dashboard.’ In the next menu, you can change the default grey-coloured name of the element to give individual graphics a title. For example, we could call the Keywords element ‘TOP 10 KEYWORDS.’
Shuffling elements around with drag and drop
Once you’ve added various elements from different parts of the XOVI Suite to your custom dashboard, use drag and drop to move them around the dashboard and position them in a way that best suits you. Simply click and hold the graphic header, drag it to its new position and let go. It’s also possible to align elements next to each other in a line, allowing for an easier overview.

Removing elements from the dashboard
Of course it’s also possible to remove elements from the dashboard too. When on the dashboard, simply click on the ‘Report’ button in the relevant element and then ‘Remove from dashboard.’

Making your custom dashboard your default dashboard
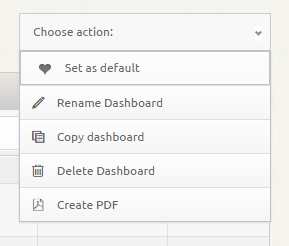
 Have you created the perfect customised dashboard which you’d like to use as default? Simply click on the ‘Set as default’ button with the heart symbol to make your custom dashboard the default dashboard whenever you log into XOVI. The original XOVI default isn’t deleted and can still be accessed under ‘Dashboard’ in the main navigational menu.
You can also see from the above screenshot that it’s possible to rename or delete your custom dashboard at any time.
Generating a dashboard PDF for a quick report
For agencies, it’s often a good idea to send clients quick updates on progress without having to produce a whole, detailed report. XOVI allows you to do just this with its Dashboard PDF function.
Click on ‘Create PDF’ at the top right hand side of the dashboard to have XOVI produce a PDF of your customised dashboard, ready to send immediately. Remember, with this quick function there’s no option to customise your PDF layout or content in the way you can in the Reporting Tool. The dashboard PDF is all about producing a quick snapshot of your project. If you’ve already set up a layout template in the Reporting Tool, this template can be selected for your dashboard PDF so that things such as your logo and corporate colour scheme appear on the PDF.
Different uses for customised dashboards
Set up different types of customised dashboards for different aspects of your online marketing. Create one for important SEO keywords with tables and charts from the keyword tool and the monitoring tool, or perhaps an SEA dashboard with data from the SEA tool. Or combine relevant data from the Link Tool with your own data from the Link Manager to keep an eye on your off-page optimization.
There’s no need to create separate dashboards for each different project or domain. Simply set up the content of each dashboard and the respective charts will be filled with data from whichever project or domain you load up in the search field.
Conclusion
Customisable dashboards allow you to turn the XOVI Suite into YOUR Suite. Add whatever graphics and charts are most important and relevant to you and transfer specific filter settings too. If clients or bosses like regular updates on their SEO progress, simply send off a quick dashboard PDF snapshot to bring them up to date. Finally, organise your dashboards into different field areas such as keywords, links, SEA and social, to better coordinate your online marketing strategy.
